Lead Foil Hat XXXI wrote:
Why would you use a linear fit to deaths? It is not linear and you and Harambe drawing a line on a bar chart is not a linear fit; please, stop trying to sound smart. It is getting old.
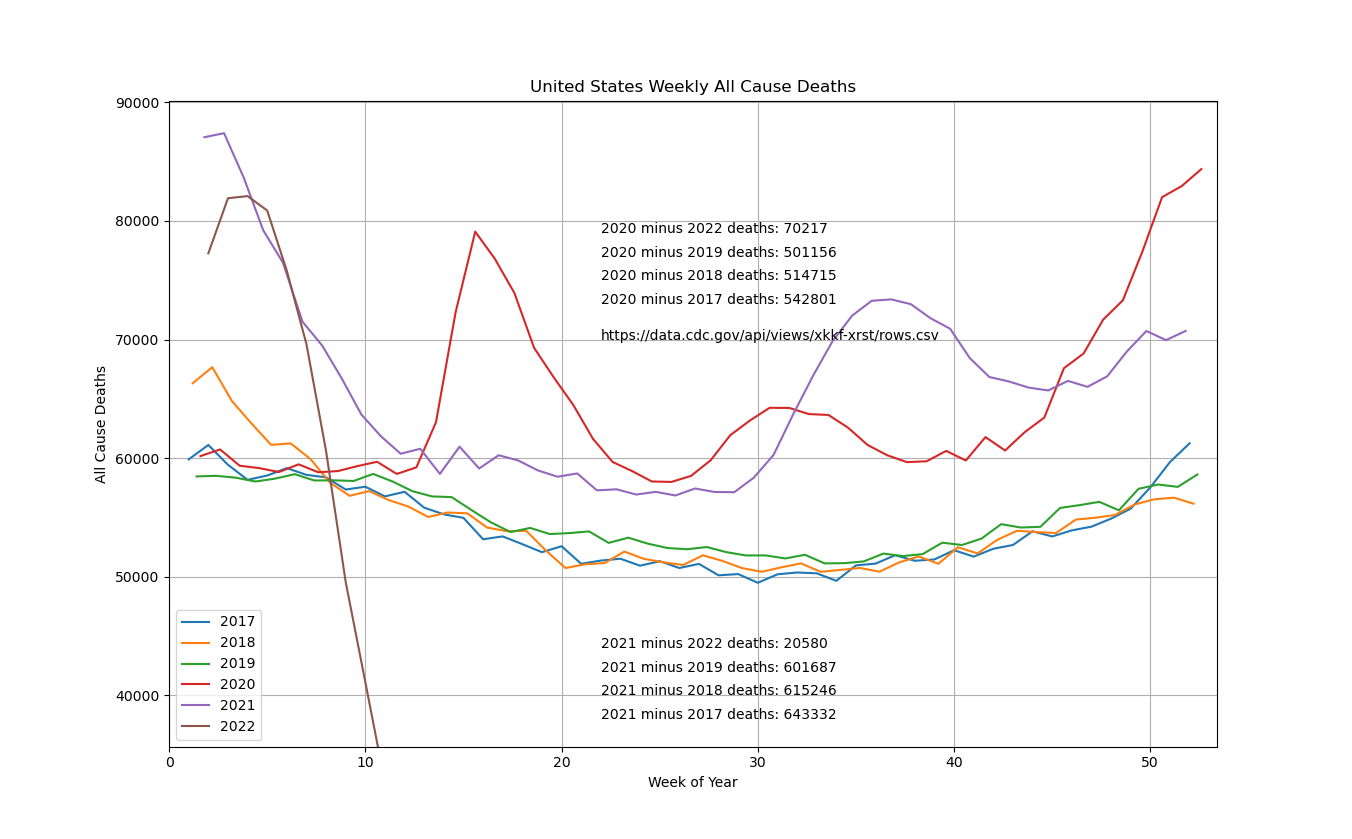
Because the trend is, in the short term, well approximated by a line.
The R^2 for a linear fit of the last 11 years of deaths (2010-2019) is .9865
Sure, it's not -perfect- but the error is not going to be huge.
This predicts 2,925,599 deaths in 2020 which basically splits the 'average expected' and 'upper bound' (2.89 and 2.98 million, respectively) of the CDC's excess death modelling.
If anything, death rates have been trending down the last couple year, so this is an overestimate, but it's well within the noise.
In any case, an estimate of about 2.92 million deaths in 2020 seems very prudent which gives 428,000 excess deaths in 2020, no big difference from the reported number!
Also validates the CDC's modelling as making sense.
So yeah, a line is a fine estimator. The excess death threshold used by the CDC was perfectly valid. And lots of people died of COVID that we didn't expect to.
Not sure why we need to run these numbers AGAIN but you're welcome.
Death data from here:
https://www.prb.org/usdata/indicator/deaths/chart/And the CDC excess deaths file.